Decoding the histogram

It’s less complicated than you think
Experienced photographers often mention the ‘histogram’ as they look through their images. Whether you’re checking the back of the camera or editing, the histogram offers a wealth of information about your image. But what exactly does it tell you?
Here we’ll cover what a histogram is, what it measures and how to use that information to take better photos.
What is the histogram?
The histogram is a graph that measures the brightness of your image. It starts at the deepest blacks on the left side and moves up through shadows, then midtones, then whites, and ends in the highlights with the brightest whites in the image displayed on the right side of the graph.
This graph can tell you which tones in your image are the strongest. If, for example, you have a spike on the far-left side of the histogram, you have a lot of dark shadows and blacks in your image.
There are two types of histograms generally used in photography. The luminosity histogram measures image brightness. The colour histogram (as seen below) measures the intensity of red, green, and blue in your image. If you took a photo of a clear blue sky, the histogram for blue would show a big spike because there is so much blue in the image.
What’s in my kitbag?

Colour channels show how much of each colour there is in your image
How to read your camera’s histogram
Your camera’s histogram can tell you a lot, once you know how to read it.
Clipping
Clipping means the details in the highlights or shadows are getting completely lost. Clipped shadows are fully black, clipped highlights are all white. A large spike on either end of the histogram and/or the data touching the far edge of the graph means you probably have clipping.
Contrast
The histogram can also tell you how much contrast is in your image. Lots of data on the left side of the graph means your image is darker, with heavy shadows and/or blacks. The opposite means it’s very bright with strong highlights and/or a lot of white in the image. If your histogram shows data bunched in the centre of the graph it could mean you have a very low-contrast image.
Colours
The red, green, and blue histograms – also known as colour channels – let you know how much of each colour there is in your image. A photo taken indoors under fluorescent lighting may have a greenish cast and a lot of data shown in the green channel histogram.

Data on the left side of the graph means your image is darker, with heavy shadows
How to use the histogram
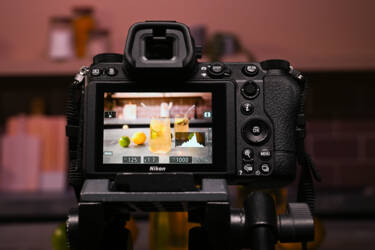
All of the above information can inform a photographer while they work. It’s common practice to set up the scene and monitor how the histogram on the back of the camera changes, but you can also use the histogram in playback mode after you’ve shot images.
First make sure you have histogram view enabled. Go to menu > custom settings menu > d. shooting/display > d19 and/or d/20 Custom monitor/viewfinder shooting display. Depending if you want to view histogram in viewfinder or monitor, or both, make sure display option showing it is enabled. When shooting you may need to toggle up or down to switch to histogram enabled display view (depending how many display types you have enabled) et voila! You can view the histogram live as you compose in your viewfinder and/or monitor.
If you want to check histogram in playback go to menu > playback menu > playback display options and make sure RGB histogram is enabled. Then when playing back your images (again, you may need to toggle up or down to switch to histogram enabled display) you can view the histogram next to the images you already shot.
When editing, the histogram is a valuable tool for tracking how your edits affect your image’s exposure. Raising or lowering the exposure will change the graph. So does adjusting the colours. Advanced editors can manipulate both the global histogram and individual colour channels to achieve the colours they want in a photograph.
Programmes such as Adobe Lightroom provide extra assistance in making sense of the histogram. If you have clipped highlights or shadows, a small triangle will appear on that side of the graph. When you click the triangle, you can see what areas lack detail and try to recapture that information in the edit.
If you plan to print your photos, the histogram helps check contrast and exposure before you print. Since different screens can display photographs in different ways, the histogram helps provide a standardised way to determine whether that deep contrast you’re so happy with in the edit will show up in a physical print.
Working in RAW instead of JPEG photo format will give you more data, which allows you to adjust the histogram more in the edit. You’d be surprised how much you can elevate the shadows of a RAW file and have the image remain intact. Do not, however, think photographing in RAW means you don’t have to worry about your exposure. You have more leeway, but even RAW images can be so under or overexposed that you can’t save them.
As with any metric, the histogram is not infallible. You don’t have to aim for perfectly balanced tones every time. Sometimes you may want a darker, moodier image or a low-contrast scene to evoke a certain feeling. Use the histogram as a guideline and double-check your work with your eyes.
More in Camera 101s
Get started here

Unlock greater creativity


